1.1) Introduction
Standing Waves and Signal Reflection are explained in this article in an easy to understand none-mathematical manner using facts that have been published in other articles on this website. These facts have been established by using measurements with specially designed test equipment, calculations, simulations and straightforward logical analysis. What is being imparted here is real knowledge gained in a logical progressive manner and often deviates from the accepted classical understanding of RF behaviour.
1.2) A little history
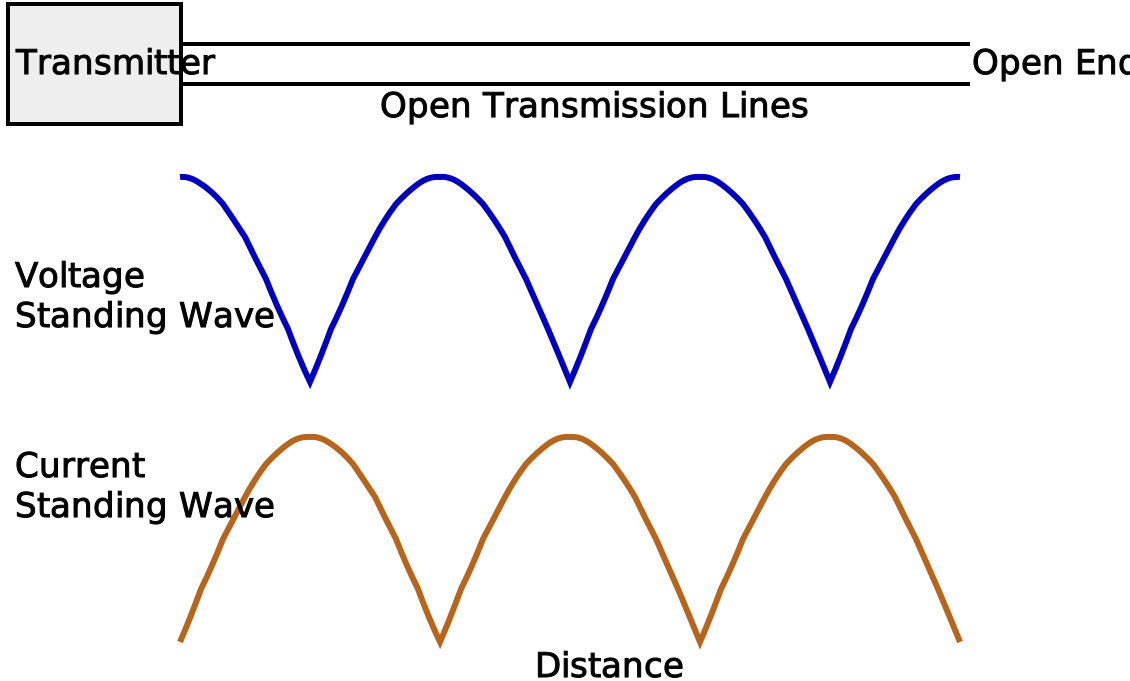
It is easy to imagine an engineer, maybe Phillip Hagar Smith himself (he of Smith Chart fame), in the old days of Open Transmission Lines measuring the Voltage in relation to ground along the open lines (I would like to place a suitable image of the measurement being made here but have not been able to locate a suitable one). By using a loop around a single conductor, they could also measure current at the same points. After making these measurements at regular intervals along the line, they could use the results to construct plots showing Voltage and Current in waves as similar to the ideal ones shown in figure 1.
Figure 1 showing ideal 'Standing Waves' along a Transmission Line into an OPEN
Measurements show that these plots are a realistic representation of the 'Standing Waves' on a lossless Transmission line. It can be seen that when the Voltage is at its maximum, the Current is at its minimum and vice versa. It is also shown that with an OPEN End, the Voltage is always at its maximum and the Current is always at its minimum at the actual OPEN. How can electrons travelling at slightly less than the speed of light be measured standing still and even more than that, these finite physical particles have their measured properties of Voltage and Current positioned in two separate places? Is the old classical theory that Voltage and Current are out of phase correct? How about the more modern theory that the physical electrons follow behind the Voltage and Current at a slower speed? Without a considerable amount of study, the plots obtained seem to be illogical and it is hardly surprising that the conclusions reached in the past are also illogical.
1.3) Propagation
Free electrons in a vacuum travel at the speed of light but electrons in a conductor travel at a lower speed and in a good conductor with no covering this will be approximately 0.82 x the speed of light. This means that there is a propagation time for the electrons travelling along the length of a Transmission Line and if you were able to see the Voltage along the line, you would see a sine wave appearing as a blur like on an un-triggered oscilloscope. If you could then blink your eyes in time with the sine wave, it would then appear as a stable triggered sine wave on an oscilloscope, see Figure 2. The voltage at the OPEN end is continuously changing and at any instant it is due to the output Voltage of the Transmitter and the propagation delay of the Transmission Line. It is not a constant voltage as observed in the Standing Wave measurements.
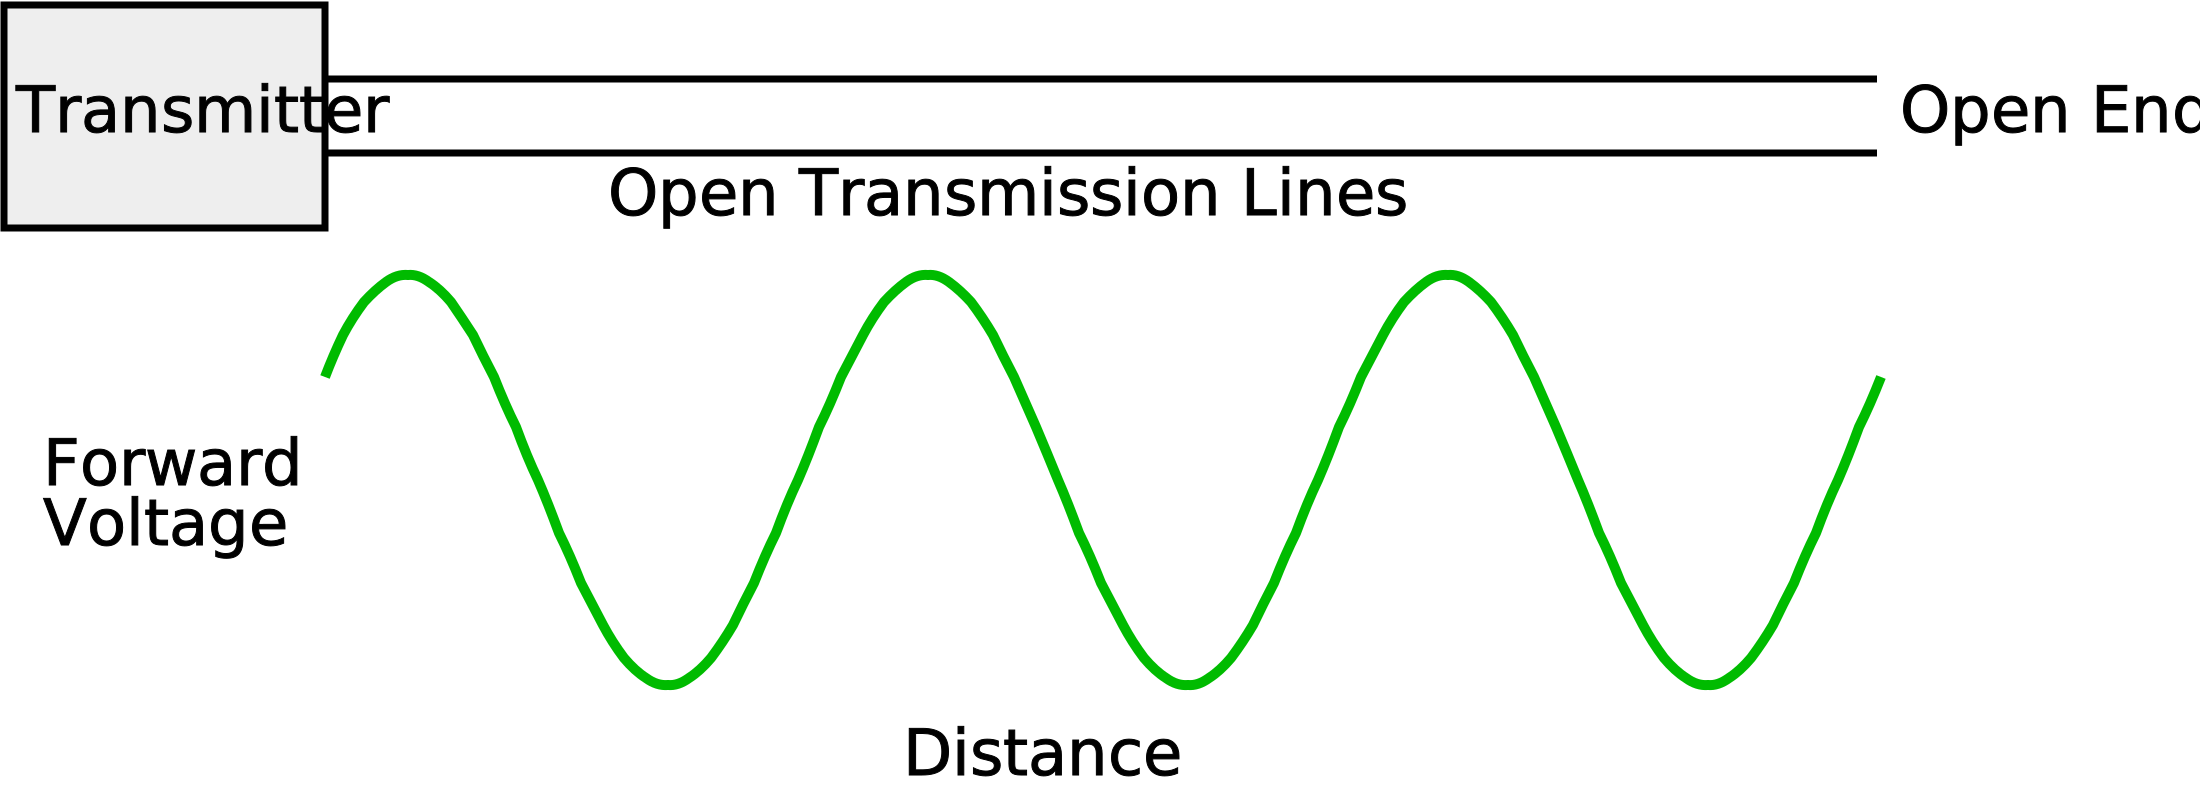
Figure 2 showing a Forward Travelling Wave along a Transmission Line
1.4) Signal Reflection
In order to understand the subject of Standing Waves, it is most important to understand that there is a reflected voltage involved. These reflections are measured every day by engineers using Vector Network Analysers to measure S11 and S22 and by engineers using Time Domain Reflectometers, the presence of reflected waves is indisputable. It has long been understood that a miss-terminated transmission line causes a signal reflection and test equipment for measuring this was patented as early as during the first world war by E. H. Armstrong. It is necessary to take signal reflection into account when studying standing waves and this was probably not done adequately judging by the conclusions reached.
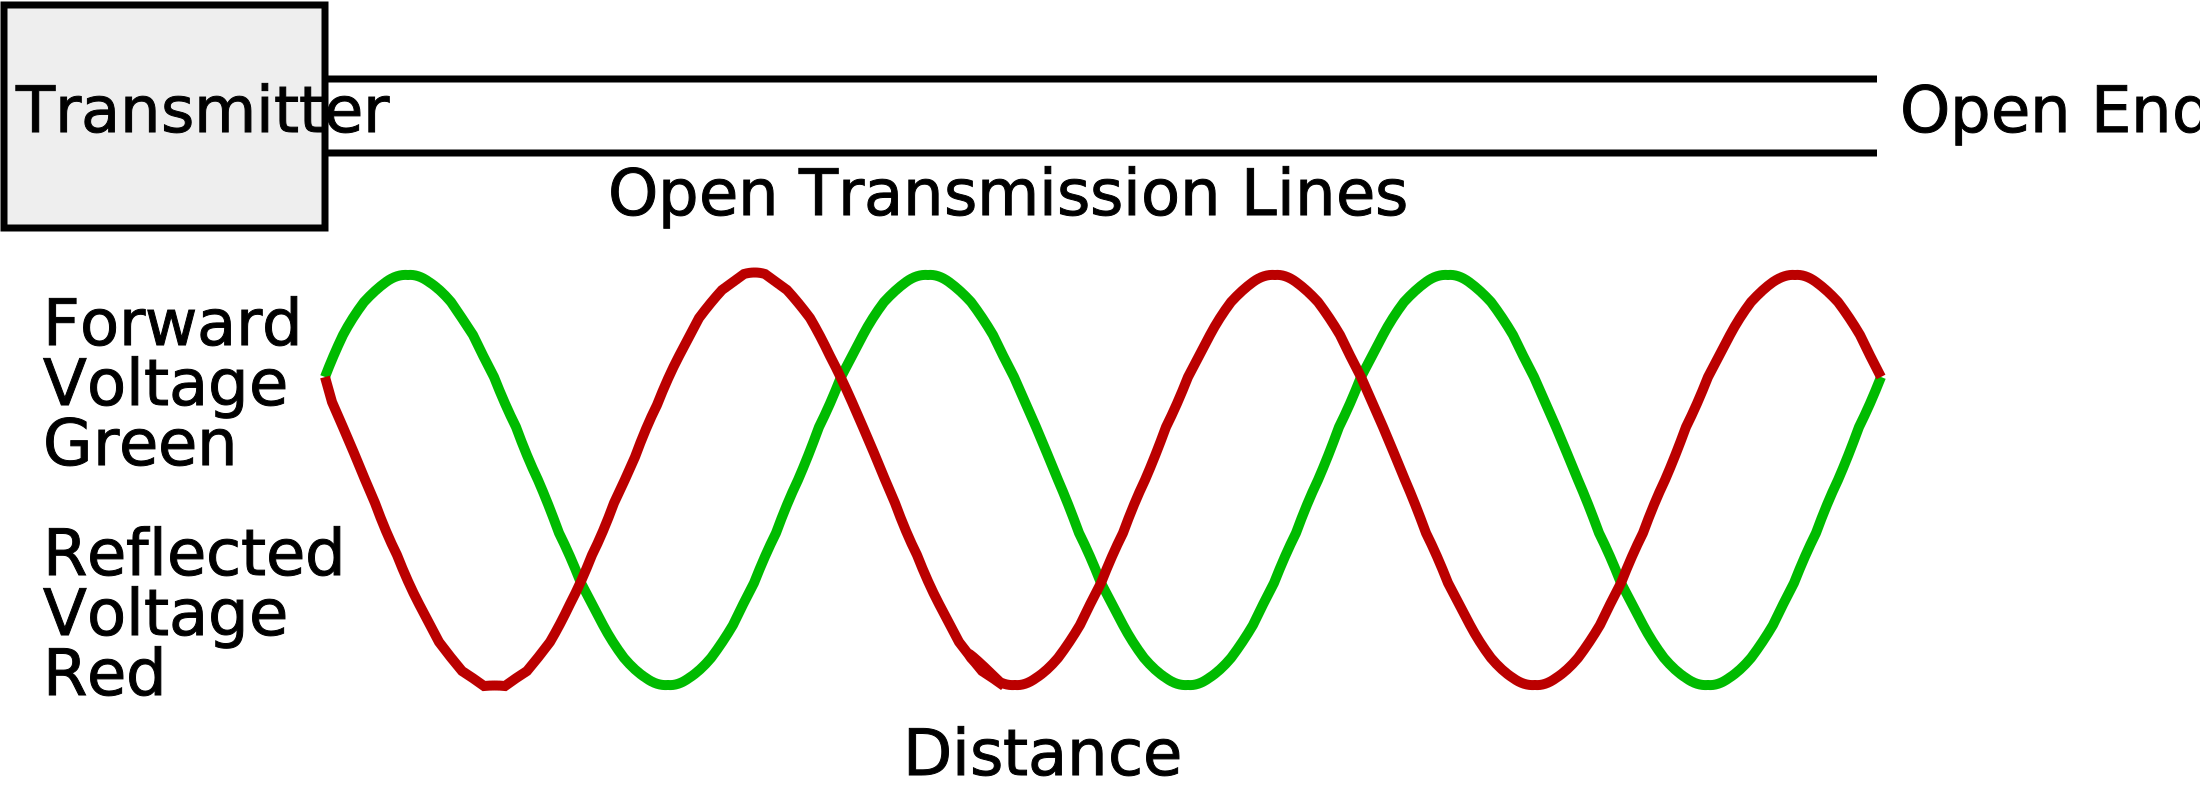
Figure 3 showing Forward and Reflected Travelling Wave Voltages along a Transmission Line
It is shown in figure 3 that the peak Travelling Wave Voltage along the lossless Transmission Line remains constant all along its length and this is true of a physical Transmission Line, except that there is a gradual loss of Voltage along the length in both directions due to attenuation. There are no 'hot spots' present as suggested by the Standing Wave plots.
1.5) Correlation of Standing Wave Voltages and Travelling Waves
If a plot of a Standing Wave is superimposed onto a plot of Travelling Waves as in figure 4, a pattern emerges that can help towards explaining what is happening. The minima of the Standing Wave occur at the point where the Forward Travelling Wave Voltage is equal to the Reflected Travelling Wave Voltage. The same is true for the Voltage maxima which again appear at the equal Voltages of the Forward and Reflected Travelling waves.
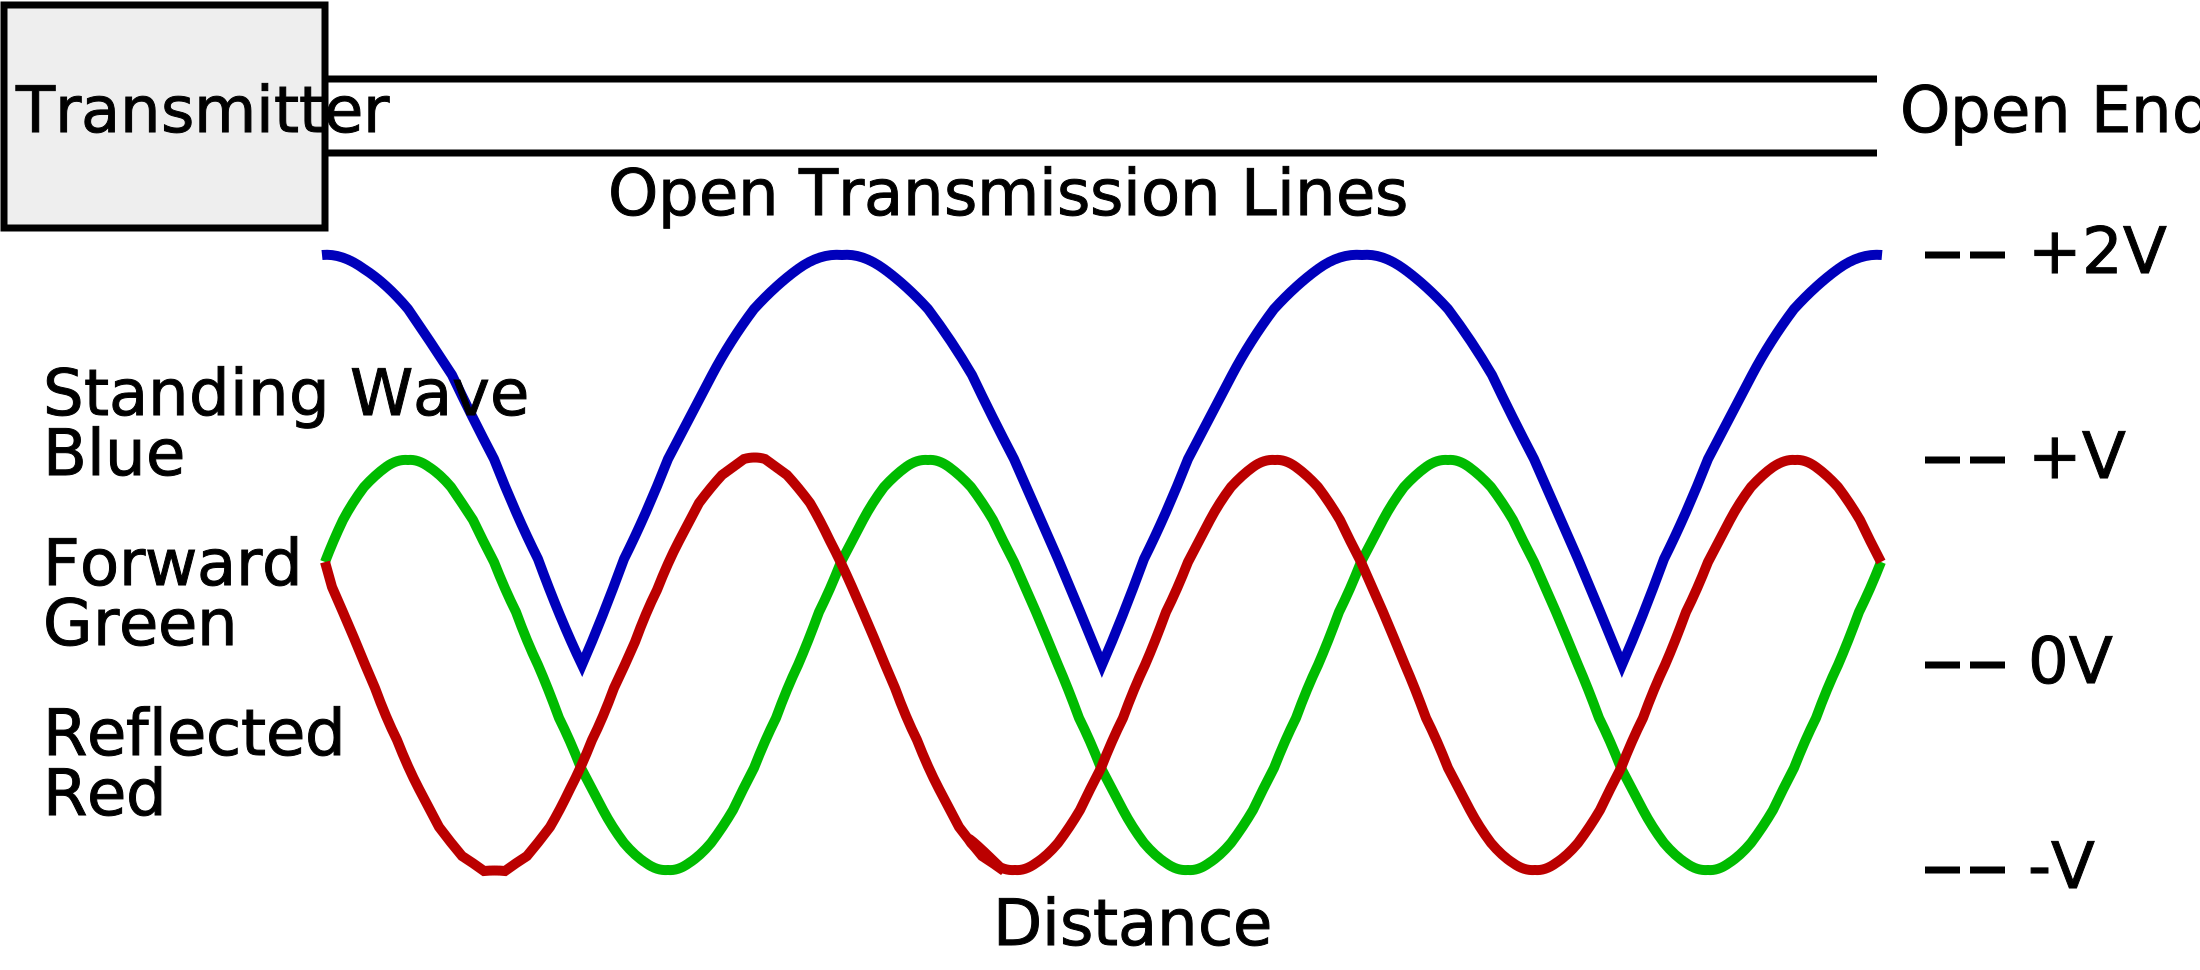
Figure 4 showing Standing Waves with Forward and Reflected Travelling Waves along an OPEN Transmission Line
So, what can we deduce from this plot? The Voltage/Phase of the Travelling waves is constantly changing but the Standing wave is stationary.
1.6) Points of interest on a Voltage Standing Wave
The only obvious points for study that emerge from this are firstly the conditions at the OPEN end. Note that it is impossible to measure the actual Current right at the OPEN end but we can measure the Current near the OPEN end and extrapolate the expected Current. However, this requires an assumption that the behaviour at the open end is the same as along the cable length and an assumption is not a proof. The next obvious place to study is the first Voltage minima of the Voltage Standing Wave from the OPEN end and we can measure both Voltage and Current at this point.
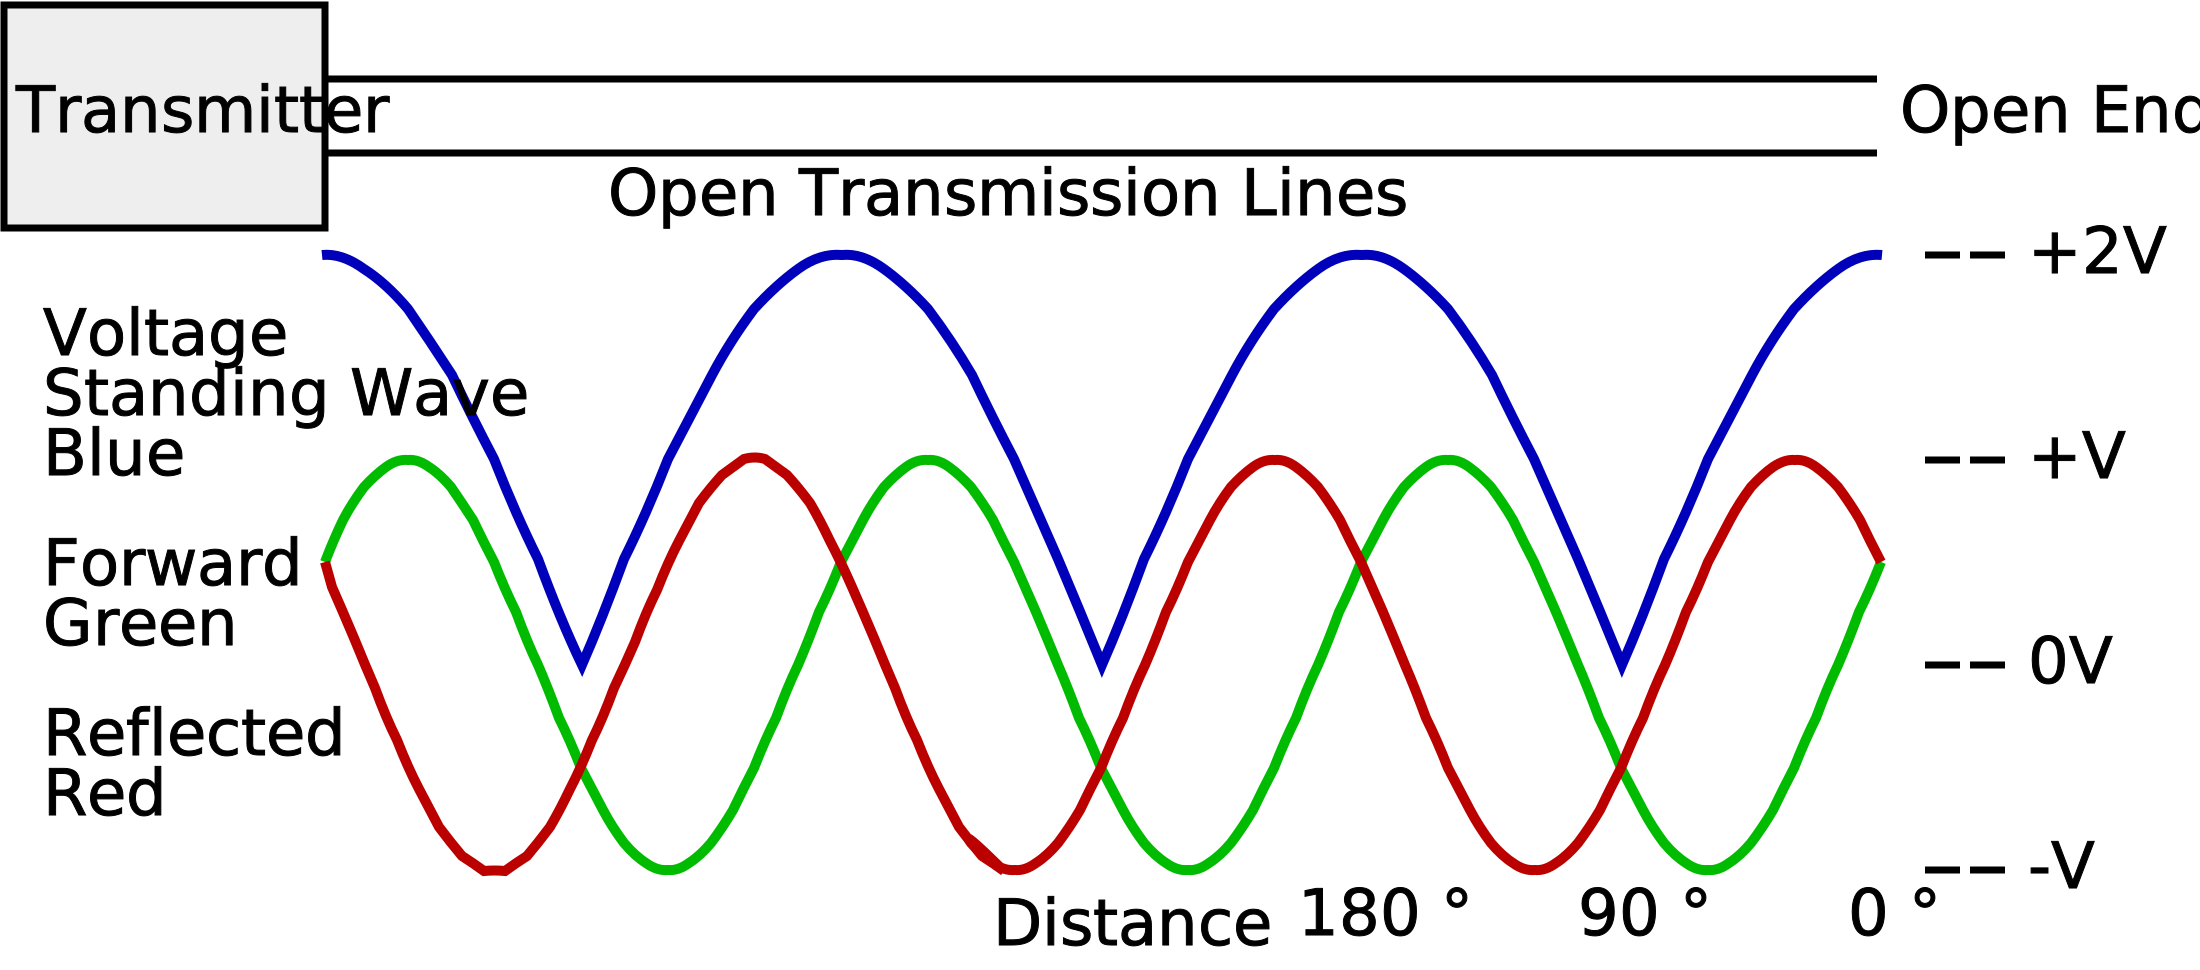
Figure 5 showing a Voltage Standing Wave with Forward and Reflected Travelling Waves along a Transmission Line with Phase in Degrees
The point where the first Voltage Minimum from the OPEN end occurs can both be measured with a Voltmeter and calculated as being a quarter wave or 90° from the OPEN end. The calculation being performed using the Travelling Wave Frequency and the speed of light adjusted with the velocity factor of the cable.
1.7) Points of interest on a Current Standing Wave
The points of interest on a Current Standing Wave are somewhat similar except the 90° point is a maximum and therefore not so well defined.
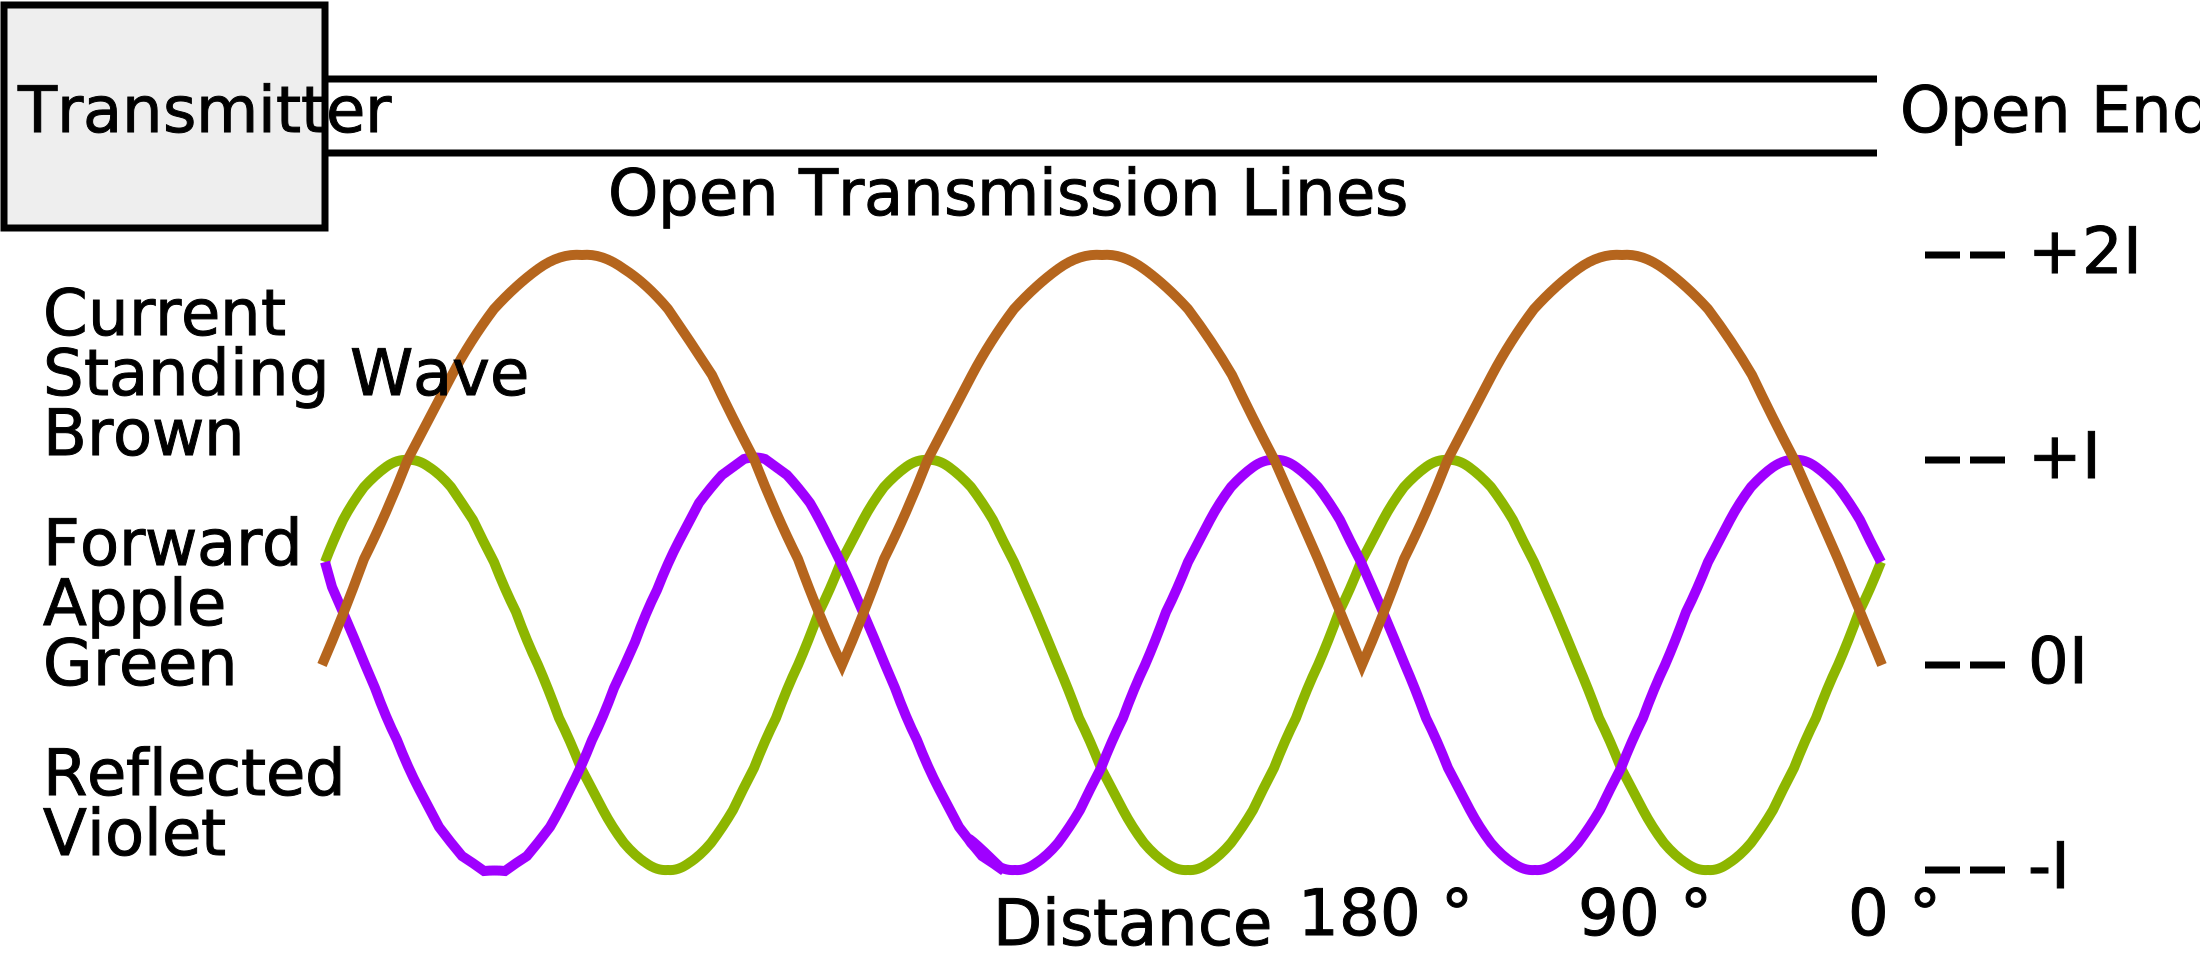
Figure 6 showing a Current Standing Wave with Forward and Reflected Travelling Waves along an OPEN Transmission Line with Phase in Degrees
We will focus the study on the 90° point for both Voltage and Current in an OPEN Transmission Line and compare the behaviour into SHORT at the end.
Technical Articles Index First Published on 21/10/2026 by William J Highton